Sizing the Prize: Estimating Global Market Sizes for Medical Devices
With continued slow growth in the United States and Western Europe in many device categories, medical device companies need to redouble efforts to drive growth in the rest of the world. Unfortunately, there is a scarcity of reliable secondary data for all but the largest device categories. When combined with few or no strategic marketing professionals and constrained market research budgets at country levels, it quickly becomes difficult for companies seeking accelerated international growth to make informed decisions about such critical issues as acquisitions, resource allocation, and switching from distributor to direct sales. Given these circumstances, it is not surprising that many companies find themselves unable to pursue their international growth goals with confidence.
For most medical device companies, estimating global demand for their products is a foundational part of growth planning activities. However, our work with device manufacturers has identified three common pitfalls that adversely affect accurate market sizing:
- Local Resource Constraints: To deal with the dearth of good data, many organizations leverage whatever local resources they have to collect the best estimates of local market sizes. Inevitably, this approach leads to the wide variance in the quality and reliability of the output. In some geographies, market size estimation is carried out by a local colleague who has the time, energy, and information to do so. In other geographies, however, the task often falls to an individual in a region or country organization who is already overwhelmed with other responsibilities and has little time to do more than a gut-based estimate or a cursory refresh of estimates from prior years.
- Inconsistent Data Availability & Integrity: These locally developed estimates are based on a range of inputs—for example, company-reported regional sales, estimated market shares of publicly-traded competitors, and industry estimates of relevant procedure volumes. As with local resource levels, the quality of data sources is extremely variable. While developed regions may have access to robust third-party research data, emerging markets often find it difficult to locate good information. In some cases, even industry associations profess difficulty estimating basic market size building blocks, such as
procedure volumes, at the local level. Unfortunately, it is often the case that markets with the least reliable data are the most dynamic and have the fewest local resources available to size the market. In essence, the markets that require the most diligent estimation efforts end up being the most neglected. - Variability in Methodology: As a result of the resourcing and data availability challenges described above, approaches to estimating market size tend to vary as well. The wide-ranging quality and reliability of these “bottom-up” estimates can be influenced by any number of factors. Frequently, the market volume and end market pricing inputs in question include:
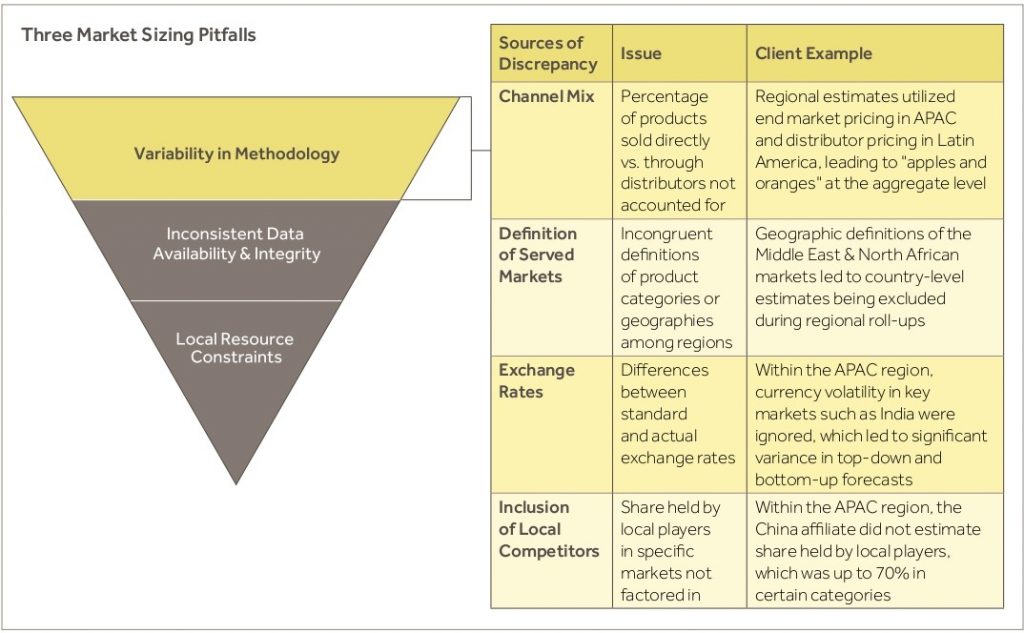
By the time “bottom-up” market size estimates are aggregated across the organization, there is a good chance that the resulting market size estimate represents an amalgamation of inputs and approaches that would be difficult to reliably replicate in any given region or at the corporate level. While it may be unreasonable to think that a single, standardized approach could be used across such disparate markets, there is clearly value in articulating a methodology that is standardized enough to minimize inconsistencies, yet flexible enough to accommodate differences in data availability and market dynamics at the local market level.
How It’s Done
In our work with global medical device companies, we have found that the global market for a given product category can be sized using a three-step approach. This approach is input-driven in nature and can be used both for developing initial market size estimates and refreshing estimates on a go-forward basis. Here is a detailed look at each of the three steps:
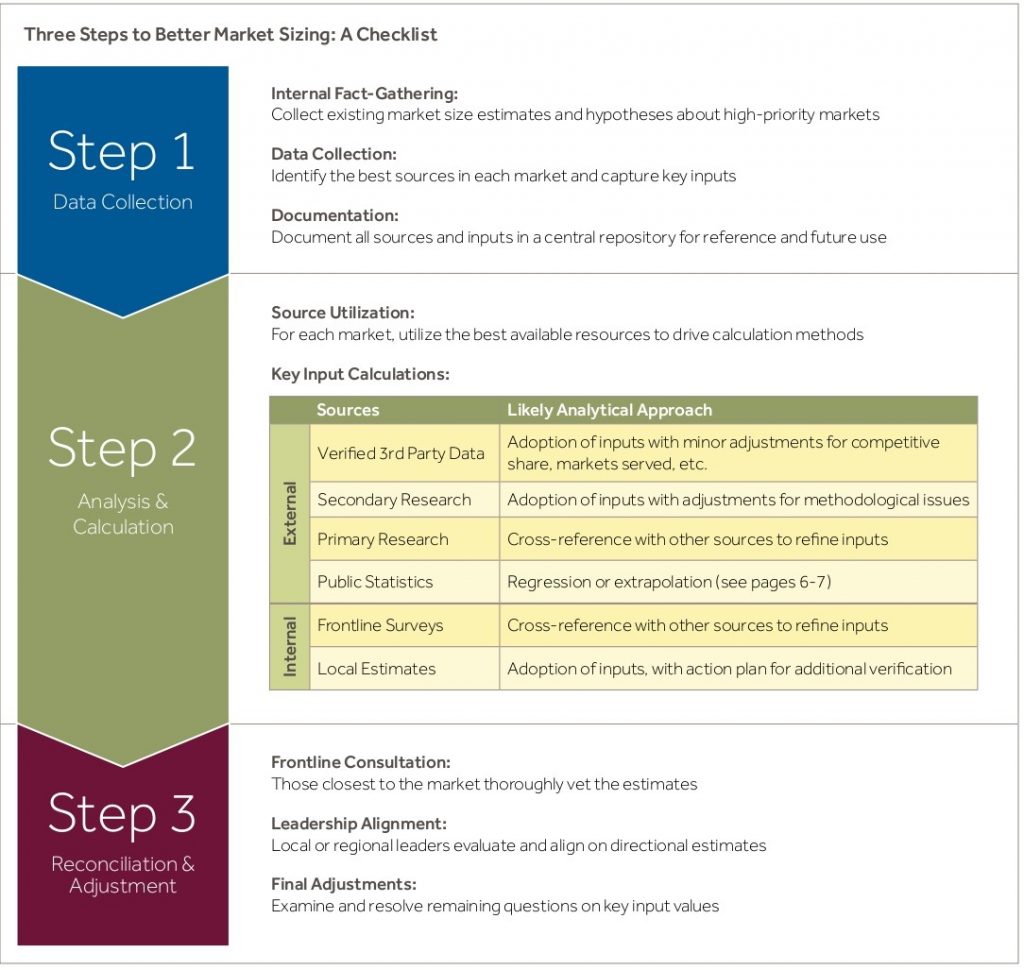
Step 1: Data Collection. While the type and volume of data collected may vary by region, it is critical to collect all relevant inputs prior to drawing any conclusions about market sizes. Data collection should be centered around identifying inputs that have the biggest impact on price and volume estimates, with an additional focus on variables that impact the magnitude of end-market estimates, such as distributor mix or product adoption rates.
| Common Foundational Variables for Market Sizing |
| • Procedure Volume or Disease Incidence • Unit Volume • Average Selling Price • Channel Mix • Product Penetration / Adoption • Product Mix |
The key steps to collecting these variables are as follows:
a. Conduct internal fact-gathering. This initial step is important not only for understanding what sources and analyses already exist within the organization but also for gathering internal perspectives on which markets require the most attention. Unless time and resources are truly limitless, it is impossible to give all markets equal attention in the process. Internal hypotheses about which markets require the most attention, therefore, become extremely valuable.
b. Execute data collection efforts. Once market priority and baseline estimates have been established, the data collection effort can begin in earnest. Data collection mechanisms will vary by market, but organizations should consider utilizing some combination of the following sources:
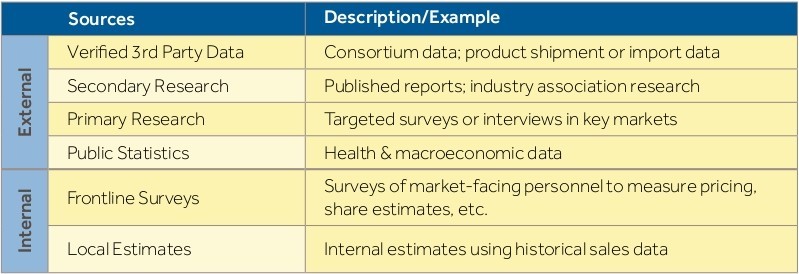
The results of this effort should be all the market-specific data points required to construct market size estimates. Since multiple data collection efforts will be occurring simultaneously across the company, it is important to follow an established “order of preference” when collecting data.
c. Document sources and inputs. While people may change roles within organizations, the need for periodic market size refreshes does not. All sources used for local market estimates must be documented and aggregated in some kind of central repository for future reference. Diligent data documentation ensures that the market sizing methodology is not just tribal knowledge, but a defined process with tangible inputs. It also gives senior leadership confidence that local resources have been thorough in their data collection efforts and facilitates future refreshes of market size estimates.
Step 2: Analysis & Calculation. Now that the data has been collected, a structured process should be followed for calculating market sizes. The calculation methods are largely dependent upon the source of the inputs. To better illustrate the approach, here are recommended methods for calculating market units using four different sources:
- For verified third-party data or secondary research: In most cases, these sources are the best available, so unit and pricing estimates are adopted as reasonable baselines. A number of factors may lead to these baselines being adjusted. Country-level personnel tends to be the best resources for identifying and making such adjustments and should be consulted during the reconciliation process if they are not directly involved in the market sizing effort.
- For targeted primary research or internal surveys: Whether utilized independently or as a complement to secondary data, inputs from these sources should be aggregated to create a “continuum” of potential unit estimates. At this stage, documenting the information is as important as selecting a point estimate since this data will likely be revisited when market size estimates are finalized.
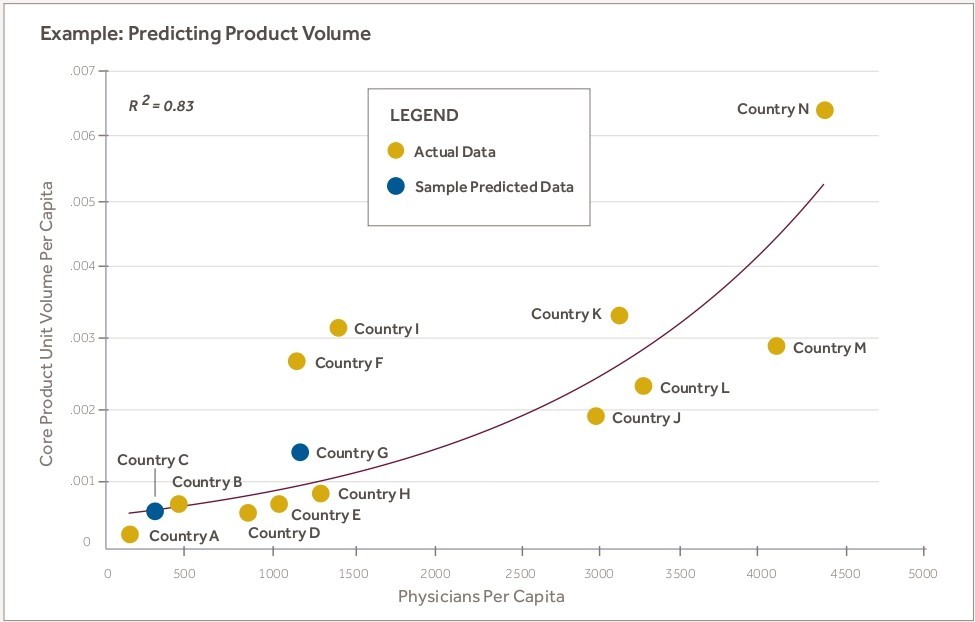
- For publicly available health and macroeconomic data: In markets with the least reliable data, the only viable starting point may be basic health statistics such as healthcare spending per capita, the number of hospital beds, or the prevalence of a given disease. For many devices, this data can still be useful in estimating directional demand. For example, we have found that regression analyses can reasonably predict procedure volume or unit volume for certain medical devices if the model can be properly fitted using markets where the procedure or unit volumes are known. While there are certainly externalities that, for instance, make the German market different from the Cambodian market, this approach creates a baseline where there previously wasn’t one.
Example of Analysis & Calculation Methods
During a recent engagement with a global manufacturer and distributor of medical devices, Blue Ridge Partners worked closely with the product teams to develop a mathematical method for reliably estimating core product demand in geographies where little to no existing data was available. In developing the approach, it was critical to ensure the methodology was as simple and repeatable as possible so internal stakeholders could easily refresh estimates in the future.
To construct the model, Blue Ridge Partners first identified data sources for dependent variables. Since availability and simplicity were most important, the best sources aggregated country-level macroeconomic and health data, such as the World Bank or the World Health Organization. We then ran over 50 multiple regressions using the data collected to predict several dependent variables, such as procedure volumes and per capita demand for the core products themselves. When multiple models of acceptable reliability were identified, additional analyses were run in a “stepwise” fashion to home in on the most predictive one. After selecting the best model, we further tested the fit of the model by running regressions comparing demand predicted by the model to demand observed in countries where overall unit demand for the core products was known. The final model was then used to predict unit volume in countries where demand had been extremely difficult to estimate. Those estimates were included in regional market size estimates.
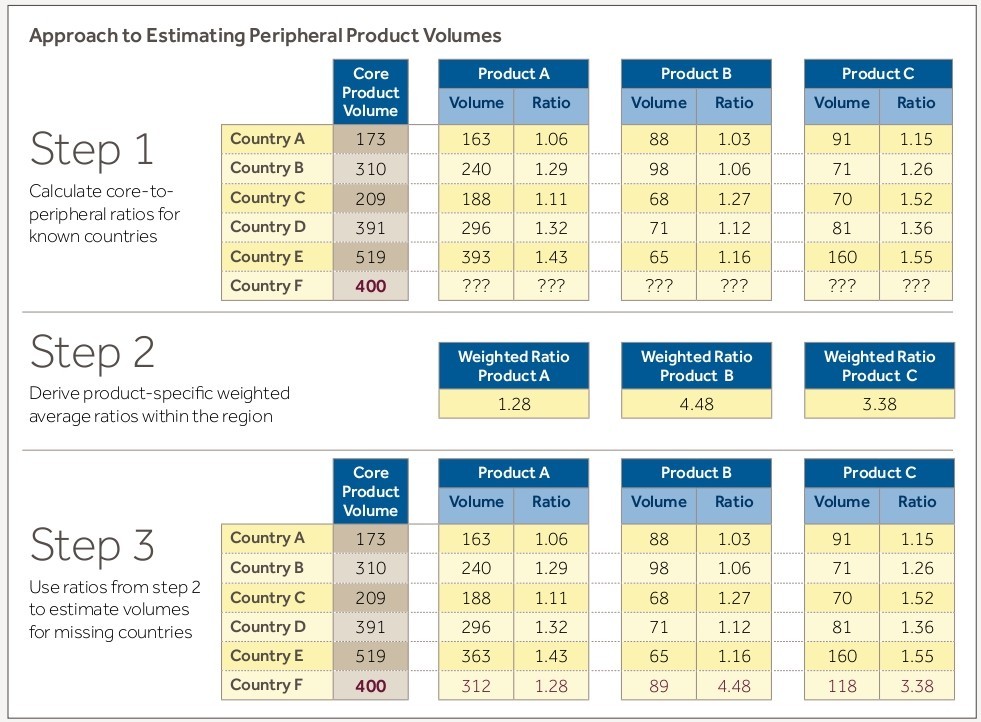
In addition to creating the demand estimation model for the company’s core products, Blue Ridge Partners used an extrapolation approach to estimate demand for its peripheral products used in conjunction with the core products. First, we segmented the company’s end markets into similar geographies. Next, we calculated peripheral product usage ratios among countries in those geographies for which verified third-party shipment data was available, which gave us an estimate of the extent to which peripheral products were used with core products. Finally, we applied a regional weighted average of these known peripheral product usage ratios to our core product estimates for countries in which reliable peripheral product estimates were previously unavailable. We chose to use a regional (e.g., Central Europe, Eastern Europe, etc.) weighted average because differences in external factors such as reimbursement policy and clinical practice influence device usage at the country level and are difficult to control for in the estimation process. With these baseline estimates for core and peripheral products in hand, we worked with the region- and country-level organizations to refine them as needed based on local market knowledge.
- For internal estimates using historical sales: This is perhaps the most common estimation method we encounter, and for obvious reasons is the most variable in terms of quality and accuracy. At best, the approach tends to be undocumented and difficult to replicate; at worst, it ignores any market-based inputs and is purely based on the experience of those estimating market size. However, one very useful application for this method is for niche products that are difficult to estimate by other means. We have found that the ratio of core products (those responsible for 80 percent of total revenue) to peripheral products can be used to estimate peripheral product volume once core product volumes have been determined. While product ratios and unit estimates can be calculated at the country level, we typically find it is more accurate to calculate ratios at the regional level (e.g., Western Europe or the Middle East rather than Portugal or Qatar) and then apply the regional ratio to country-level core product unit estimates. Doing so helps mitigate the effect of noise created by different reimbursement environments, device usage variance due to differing clinical practices, and other market-specific factors. Again, the objective of this analytical method is merely to establish a baseline where one did not previously exist; in Step 3, we will discuss how to further refine the accuracy of these estimates.
To estimate pricing, a similar inputs-driven approach should be taken. Compared to sources for units, however, sources for pricing data can be a bit sparse; therefore, it is critical to take a “triangulation” approach to estimate the average selling price (ASP) for key products. If possible, a combination of secondary sources, internal surveys, and targeted primary research should be used to compile a range of ASPs within each key market. Prior to settling on the ASP to use for calculating market size, it is important to consider several factors:
- End market pricing vs. distributor pricing. Since many companies use some mix of direct sales and distributors to move products, it is important to track prices both to distributors and to end market participants ( e.g., hospitals or physicians’ offices). Not doing so risks underestimating the true size of the market, which may prevent senior leaders from being able to decide when a market is attractive enough to alter the go-to-market model in favor of direct sales. In addition, tracking both ASPs makes it easier to ensure consistency among price inputs used to calculate the market size. Since distributor pricing can be extremely difficult to ascertain, we recommend collecting end-market prices and using an internal estimate of the percentage of sales to distributors within each region. Both data points can be ascertained from market-facing staff via a survey or internal conversations.
- Secondary research for price data. If secondary research is used to estimate ASPs, it is important to understand the data collection methodology. For example, we have found that some secondary sources who use surveying methods systematically overestimate pricing because their responses are disproportionately comprised of Tier I hospitals with large, private-pay populations. We have found that research firms are often forthcoming and candid about their estimation methodologies, which enables organizations to more easily make adjustments to ASPs.
Once baseline unit and pricing estimates have been developed, the final step is to ensure internal alignment on key inputs and subsequent market estimates being used in each market.
Step 3: Reconciliation & Adjustment. Adjusting key market inputs is an exercise in both shoring up weaknesses in market models and creating internal buy-in for the estimates being used. There are several key steps to follow:
a. Solicit additional input from the front lines. If the process thus far did not incorporate input from the sales force or from local marketing staff, now is the time to get reactions from those closest to the business. Feedback on pricing trends, product penetration, and competitive actions are frequently areas where local intelligence has a big influence on estimates.
b. Review results with local leadership. Since country managers or regional leaders are ultimately the ones responsible for delivering against growth targets based on market size estimates, it is critical to ensure those leaders agree with the methodology and results. Consulting market-facing personnel in advance of this conversation typically adds significant credibility to market size estimates.
c. Conduct additional follow-ups. After several rounds of review, there will typically be a handful of markets where a few key inputs are still in question. Additional primary research may be warranted here, typically in the form of expert interviews, conversations with key customers, or internal surveys of the sales force. Other final adjustments, such as converting pricing from standard to actual exchange rates, should also be addressed here.
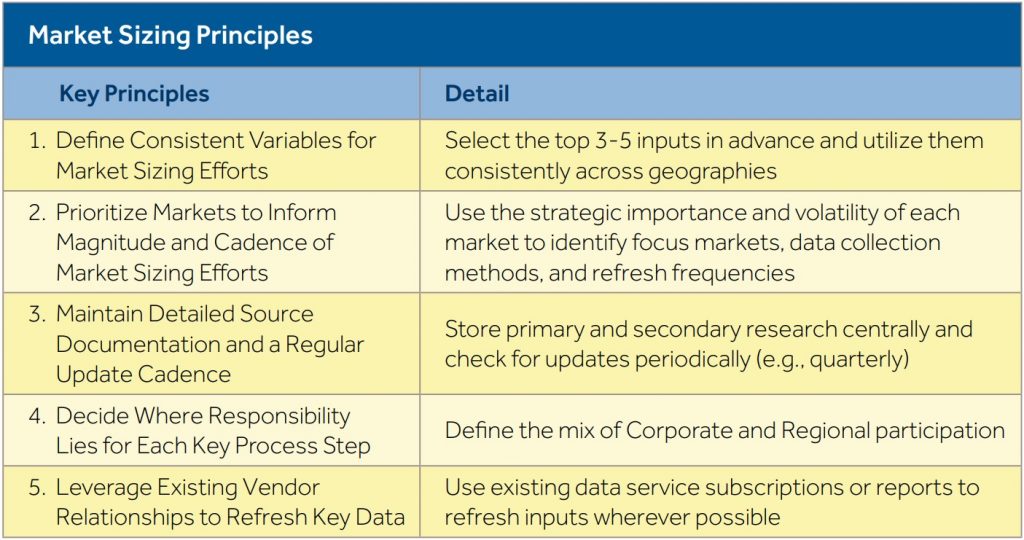
Key Principles Governing Ongoing Market Sizing
After following the approach described above, organizations will have more than just a snapshot of global market size at a given point in time— they will also have a process for regularly updating these estimates. In doing so, we suggest that organizations adhere to five key principles throughout the update process:
The Impact of an Enhanced Market Sizing Methodology
Instituting more rigorous market sizing practices can have far-reaching effects. On a recent project with the largest division of a global medical device manufacturer, applying this methodology revealed that on a worldwide basis, the company had been underestimating the size of the market by nearly a billion dollars. This realization led to the manufacturer implementing the recommended approach on a go-forward basis. The division established a permanent position for managing the process across local markets and began actively tracking two market size estimates—one to compare the company’s performance to competitors for the purposes of external financial reporting, and one to make strategic marketing decisions based on regional estimates of end-market size. After discussing this methodology during a cross-divisional marketing offsite, senior leaders from other divisions of the company instituted a similar process.
Though a revised approach to sizing the global market for medical devices requires more discipline, time, and resources, these demands can be effectively managed through thoughtful prioritization of markets, adherence to common principles, and a defined cadence for market size refreshes. Having a better understanding of potential market size is not just an exercise in data collection and analysis—it can become a decisive competitive advantage when setting strategy, allocating resources, and determining how to bring products to market.